In this post we will look at setting up a Grafana server. Rather than looking at setting up Grafana and Graphite etc… We’ll be using a pre-built docker image. We’ll also be provisioning a CentOs box as a quick way of setting up Grafana. This method of provisioning will ensure that we have a server that is somewhat more portable and consistent than a local install of Graphite and Grafana on our local machine.
VirtualBox
I already had an install of virtualbox, but needed to update it. As I run Ubuntu, it seemed best that the update manager be able to tell me if there were upgrades required.
The process for this is documented on the VirtualBox web site here.
I was running virtualbox 4 at the time, and virtualbox 5 was installed alongside it. So this allowed me to check all was fine with the new install before removing the old one. My old VMs were unaffected by the upgrade too, thankfully.
All was well, although a short while after install I ran into a problem where a virtual machine wouldn’t start up any more. It was complaining about a kernel driver not being installed. The problem and fix can be found here. As the solution is short I’ll mention the commands here too:
sudo apt-get install linux-headers-generic build-essential dkms
sudo apt-get remove --purge virtualbox-dkms
sudo apt-get install virtualbox-dkms
Although looking at my history, it seems I had to do that twice and follow it with one of these to complete the fix:
sudo /etc/init.d/vboxdrv setup
I have had no issues with VirtualBox since. So with that, onto installing vagrant…
Vagrant
Installing Vagrant was a simple process, you need to download the relevant package from their download page. Once that is done you install it.
You will need to have a directory to contain the Vagrantfile that will describe the vm. One thing to note here is that you might run into a problem where vagrant can’t chmod a private key on initialisation. In my case this seemed to be a restriction by having the directory on an ntfs usb drive. While I actually moved the directory to an ext4 one, I understand you could just move the private key there and link to that key in the directory, though I haven’t tried this.
With vagrant installed, you need to get a vagrant box. I went over here and chose to use the following commands to initialise my vagrant with CentOs7:
vagrant box add puppetlabs/centos-7.0-64-puppet
vagrant init puppetlabs/centos-7.0-64-puppet
The “vagrant init” command will make a Vagrantfile for you. It is very simple and if you look at it; you should find:
config.vm.box = "puppetlabs/centos-7.0-64-puppet"
Next you can test your vagrant box is working by running:
vagrant up
vagrant ssh
Which should log you in to your new CentOS box as the vagrant user. Log out again and run vagrant halt to shut it down. You can list your vagrant boxen by using vagrant box list.
Docker
Docker as a provisioning tool is provided with Vagrant. As I use Ubuntu I could have avoided installing Vagrant, as Docker could use Ubuntu instead. However, in the interest of learning a bit more, I’ve gone the longer route. This is a set-up that is of more interest to Windows/Mac users. It was also the reason behind choosing a CentOS distribution for the VM.
Given we have Docker ready for use as a provisioning tool in Vagrant, we can get to setting it up for use.
Add the following lines to the CentOS VM Vagrantfile:
  config.vm.define "docker-host"
  config.vm.hostname = "docker-host"
That’s all for the virtual host running CentOs that will be provisioned with docker. Next we need to set up another vagrant that will be provisioned by docker to install our Grafana image onto the CentOs host.
I’m not sure if this can all go in one vagrant file. I’ve not seen such a thing done successfully as yet. In any case; the extra separation is welcome as it gives it simpler layout. The layout required is such that there is one Vagrant file to set up the CentOS box and another to set up the Grafana container via Docker. Others could be added alongside the Grafana container in order to provision other apps too.
Given that, the current directory layout we’re going to be using looks like this:
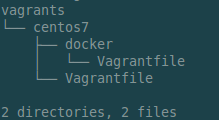
To recreate this, we begin by making another directory for the docker Vagrantfile.
Then create a Vagrantfile with the following in it:
Vagrant.configure(2) do |config|
  config.vm.define "grafana" do |v|
    v.vm.provider "docker" do |d|
      d.force_host_vm = true
      d.vagrant_machine = "docker-host"
      d.vagrant_vagrantfile = "../Vagrantfile"
      d.image = "kamon/grafana_graphite"
      d.name = "kamon-grafana-dashboard"
      d.ports = ["9080:80", "9081:81", "8125:8125/udp", "8126:8126"]
    end
  end
end
You’ll notice that we’ve pointed our docker provider to the CentOS7 Vagrantfile. This will ensure that the host we just set up is the host we are provisioning our Grafana server onto.
If you’re running Linux, then also notice the line: force_host_vm = true. This tells vagrant that instead of using the actual OS you’re using (In my case Ubuntu) that it should instead use the host you set up; i.e. CentOS.
Now to start our server up; in the directory with the graphite docker vagrantfile, run the following command:
vagrant up grafana --provider=docker
This doesn’t work out too well. You should see something like this:
Stderr: Get http:///var/run/docker.sock/v1.20/containers/json?all=1: dial unix /var/run/docker.sock: permission denied.
* Are you trying to connect to a TLS-enabled daemon without TLS?
* Is your docker daemon up and running?
This is because you need to set up docker properly before running it in CentOS. That involves doing a few things, which are documented here.
I’ll show you the full working Vagrantfile after a couple of tangents on fixing errors.
Initially I started by simply adding the vagrant user to a new docker group. All was working for a while but eventually a new error appeared which was required yum to update the server (The error explained that in this case). So to avoid that pitfall we will also need to add the following line before provisioning docker:
config.vm.provision "shell", inline: "sudo yum clean all; sudo yum -y update"
After that we continue to provision docker as before but we need to follow that up with a more complex inline shell script. As explained in the previous link, this one will create a docker group and add the Vagrant user to it. Once that is done, the Docker service is restarted to ensure changes take affect.
There is also a need, as mentioned by many others, to ensure that the ssh connections reconnect to avoid another error. The final inline shell script deals with that. So the Vagrantfile for the CentOs host now looks like this:
$addVagrantToDockerGroup = <<SCRIPT
echo Adding docker group...
sudo groupadd docker

echo Adding Vagrant to docker group...
sudo usermod -aG docker vagrant

echo Restarting docker daemon...
sudo /bin/systemctl restart  docker.service
SCRIPT

Vagrant.configure(2) do |config|

config.vm.provision "shell", inline: "sudo yum clean all; sudo yum -y update"
  config.vm.provision "docker"
  config.vm.provision "shell", inline: $addVagrantToDockerGroup
  config.vm.provision "shell", inline: "ps aux | grep 'sshd:' | awk '{print $2}' | xargs kill"

  config.vm.define "docker-host"
  config.vm.box = "puppetlabs/centos-7.0-64-puppet"
  config.vm.hostname = "docker-host"

  config.vm.network "forwarded_port", guest: 9080, host: 9080
  config.vm.network "forwarded_port", guest: 9081, host: 9081
  config.vm.network "forwarded_port", guest: 8125, host: 8125, protocol: 'udp'
  config.vm.network "forwarded_port", guest: 8126, host: 8126
You may have noticed a couple of things regarding port numbers. In the docker container Vagrantfile, you will see a ports set up to forward 80 to 9080 and 81 to 9081. This is because out of the box the port wasn’t forwarding with values less than 1024. As such Grafana will be found at http://localhost:9080 and Graphite is actually set up to be on 9081.
You’ll also notice that I’ve had to tell docker and Vagrant to deal with UDP port forwarding. This is so that statsd will work as expected.
Going to http://localhost:9080, once Vagrant is running, will now show the log in page. To access Grafana you will need a user name and password; by default these are set to “admin” and “admin”.
At this point, you may wish to look at your Grafana files and see the configuration and so on. If you type vagrant ssh to get to the CentOs box and then look around you won’t find them. What has happened? Grafana is working, but where are the files? They’re safely tucked away in the Docker container. You can verify this using the docker command.
Type: docker inspect kamon-grafana-dashboard
This will show you some JSON that will point you to where the container files are on the CentOs system. Clearly then, we need another way of accessing the actual Graphite and Statsd files.
Fortunately; this isn’t any harder than using some more docker commands. Simply run the following:
docker images
docker run -it  /bin/bash
That’ll run bash on your container. Now you should be able to find all the grafana and graphite files where you’d expect to.
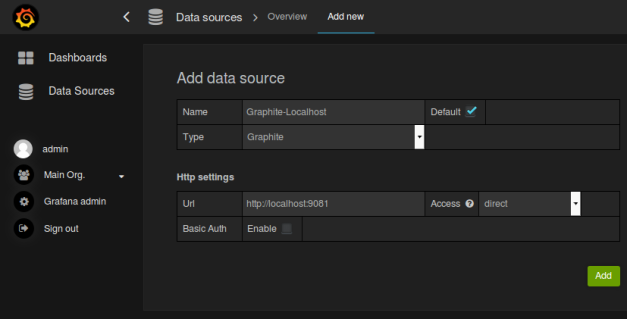
In order to test the installation, head over to localhost:9080 and log in. Once that is done you need to set up a data source. That will be our Graphite install. Click “Data Sources” and then “Add new”. Now put a name in the name box and fill out the URL box with http://localhost:9081. Change the Access to “Direct” and then hit “Add”. You can hit “Test Connection” which should work and then save the data source.
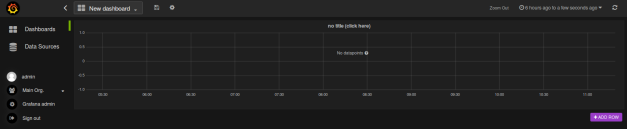
Click “Dashboards”, then click the “Home” button at the top. This lists the dashboards. Click “new” and you get to a blank page. Strangely you don’t want to “Add Row” here. In fact, you need to hover over the green line that has appeared near the menu bar and click the box that appears. Now you need to “Add panel” and choose graph.
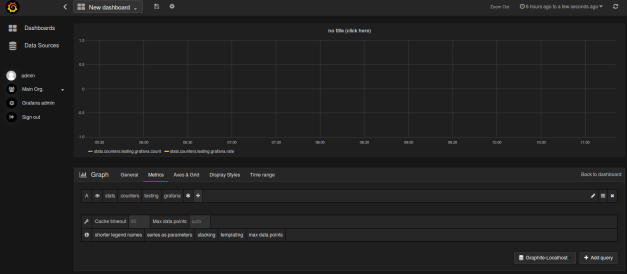
We need to change this panel to use our data source. Click the title and then edit. Now you should be presented with a graph dialog, check you’re on the metrics tab. The data source needs to be the data source you just set up, if that has been set to your default then it should show here already.
Now is a good time to ensure there is some data to view, perhaps by using statsd. To do that you need to open a terminal and run something like:
echo "testing.grafana:100|c" | nc -w 0 -u localhost 8125
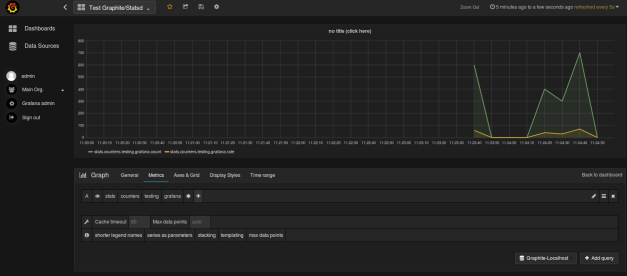
Do that a few times and it should get passed through from statsd to Graphite. All we need to do now is check it’s come through to Grafana. To do that we need to go to the metrics tab we just looked at and find the data. Click on “select metric”, then stats, counters, testing, grafana and “*”. Note that the “testing” and “grafana” data names are the ones used in the line of bash that sent data to statsd. You should be seeing a spike in the graph now. Grafana is working!
You can now use “vagrant halt” to turn off the server. However, when you start it up again you may unfortunately run into the same problem I did. That was this error message:
Failed to mount folders in Linux guest. This is usually because
the "vboxsf" file system is not available. Please verify that
the guest additions are properly installed in the guest and
can work properly. The command attempted was:

mount -t vboxsf -o uid=`id -u vagrant`,gid=`getent group vagrant | cut -d: -f3` vagrant /vagrant
mount -t vboxsf -o uid=`id -u vagrant`,gid=`id -g vagrant` vagrant /vagrant

The error output from the last command was:

/sbin/mount.vboxsf: mounting failed with the error: No such device
Somewhat annoying, it seems that the vbox guest additions needed being set up again. To fix that; go to the Vagrantfile for the CentOs box and add the following line:
config.vm.provision "shell", inline: "cd /opt/VBoxGuestAdditions-*/init; sudo ./vboxadd setup"
Now run “vagrant provision” and when you “vagrant up” grafana next, things should start working.
There we have it. A working Grafana and statsd, which can now be used to minitor all sorts of applications. Simple Groovy apps or Bash scripts can be written to test how long things take to respond, or if they’re even up and working. Spring actuator can be used to easily monitor Spring boot apps too!

Later still, while using this VM I bumped into another error. It seems my VirtualBox had been upgraded, but the VM couldn’t find the latest guest additions package.
However, there is a simple fix: Simply go to the directory with the Vagrantfile for the Centos VM and run “vagrant plugin install vagrant-vbguest”
This installs a plugin that will fix the guest additions for you when you start it up :)
Thanks much for this nice tutorial. I’m running into an issue — while I can “SignUp” on the Grafana main page, and can select a dashboard, at the first refresh, I get a notification that says Unauthorized and all data goes away. Any ideas?
Hi, unfortunately I didn’t run into the issue you have. It remembered the details via a cookie as I recall. Unfortunately at the moment I’m without a laptop to try it out and see if I can make it happen too. Sorry about that, but you might need to check your security settings?